
function distEuc(sol1, sol2)
    return sqrt(sum((sol1 - sol2).^2 ))
end

sol1 = 1:1_000
sol2 = ones(length(sol1))
distEuc(sol1, sol2)18243.72494859534A Comprehensive Overview
December 4, 2024


You cannot go against the technological platform of the project.
If you are the only person who knows Julia, no-other can change it.
Improvement of time could be important, but it depends on the project.
It work more nicely if it is integrated in Python packages.
Quixote against windmills
Matrices: Package to manage matrices in CPU or GPU (Numpy, Pytorch, or JAX).
DataFrames: To manage dataframes, read/write from CSV, Excel and other formats. It can be very complex (Pandas or Polars).
Visualization: Packages to visualize DataFrames easily (seaborn) to the lower level package to change details (Matplotlib).
Machine Learning: Package with the ML models that can be trained and applied.
Deep Learning: Create DL models, training, and inference.
| Functionality | R | Python | Julia |
|---|---|---|---|
| Matrices | Matrix | Numpy,JAX | Standard,CUDA.jl |
| DataFrames | dplyr | Pandas, Polars | DataFrames |
| Visualization | ggplot | Seaborn/Matplotlib | ggplot,AlgebraOfGraphics/Makie |
| Machine Learning | caret, mlr3 | scikit-learn | MLJ |
| Deep Learning | Keras | Pytorch, Keras | Metalhead/Flux |
Vectors and matrices are integrated into the standard library.
The code is compiled and then run, so the looping is not slow.
You can use vectorize operations (sum, filter, map, …), for conciseness, not performance.
function distEuc(sol1, sol2)
return sqrt(sum((sol1 - sol2).^2 ))
end
sol1 = 1:1_000
sol2 = ones(length(sol1))
distEuc(sol1, sol2)18243.72494859534The performance is nearly similar:
![]()
VS
![]()
It one of the better packages.
It has a great API in comparison with Pandas (easy).
using CSV, DataFrames

df = CSV.read("starwars/planets.csv", missingstring="NA", DataFrame)
first(df, 3)| Row | name | rotation_period | orbital_period | diameter | climate | gravity | terrain | surface_water | population |
|---|---|---|---|---|---|---|---|---|---|
| String15? | Int64? | Int64? | Int64? | String31? | String? | String? | Float64? | Int64? | |
| 1 | Alderaan | 24 | 364 | 12500 | temperate | 1 standard | grasslands, mountains | 40.0 | 2000000000 |
| 2 | Yavin IV | 24 | 4818 | 10200 | temperate, tropical | 1 standard | jungle, rainforests | 8.0 | 1000 |
| 3 | Hoth | 23 | 549 | 7200 | frozen | 1.1 standard | tundra, ice caves, mountain ranges | 100.0 | missing |
Package DataFramesMeta of the same author make it easy to combine operators:
using Statistics, DataFramesMeta

df_mean = @chain df begin
    # Filter with surface of water
    @subset(:surface_water .< 40)
    # Ignoring diameter missing
    @subset(.! ismissing.(:diameter))
    # Group by climate
    @groupby(:climate)
    # Calculate the diameter_mean for climate
    @combine(:diameter_mean = mean(:diameter))
end
first(df_mean, 5)| Row | climate | diameter_mean |
|---|---|---|
| String31? | Float64 | |
| 1 | temperate, tropical | 10200.0 |
| 2 | murky | 8900.0 |
| 3 | temperate | 32574.0 |
| 4 | temperate, arid | 11370.0 |
| 5 | temperate, arid, windy | 12900.0 |
using Tidier

@chain df begin
    @filter(surface_water < 40)
    @filter(!ismissing(diameter))
    @group_by(climate)
    @summarize(diameter_mean = mean(diameter))
    @slice(1:5)
end| Row | climate | diameter_mean |
|---|---|---|
| String31? | Float64 | |
| 1 | temperate, tropical | 10200.0 |
| 2 | murky | 8900.0 |
| 3 | temperate | 32574.0 |
| 4 | temperate, arid | 11370.0 |
| 5 | temperate, arid, windy | 12900.0 |
Efficient: Built on top of Julia’s powerful and efficient array-based data structures.
Flexible: It supports various data sources, including CSV, TSV, Excel, and SQL databases.
User-friendly: In combination with DataFramesMeta.jl.
Compatible: Integrated with other Julia packages, data analysis and visualization.
Strong typing: Data manipulation operations are type-stable, giving an efficient code execution.
Missing data handling: It provides robust handling of missing or null data values.
In a research project, I need to combine several columns in a specific way, to create new ones.
In pandas was not easy at all.
Neither option was efficient.
In DataFrames was very easy and efficient:
This allow to detect all columns ending with number, calling by row to a specific function, and incorporate the results as new columns.
Great documentation.
Very complex.
Author very implicated in the package, and in the community.
If all packages were as madure as this one…
Conclusion: Mature enough to use in your preprocessing workflow.
Experience in Python is using Altair and Seaborn to visualize dataframes.
Matplotlib is only used when it is required.
Makie is a complete alternative to Matplot, does not work directly with DataFrames.
AlgebraOfGraphics is a tool over Makie, inspired in ggplot2.
There are other packages: JuliaPlots, …
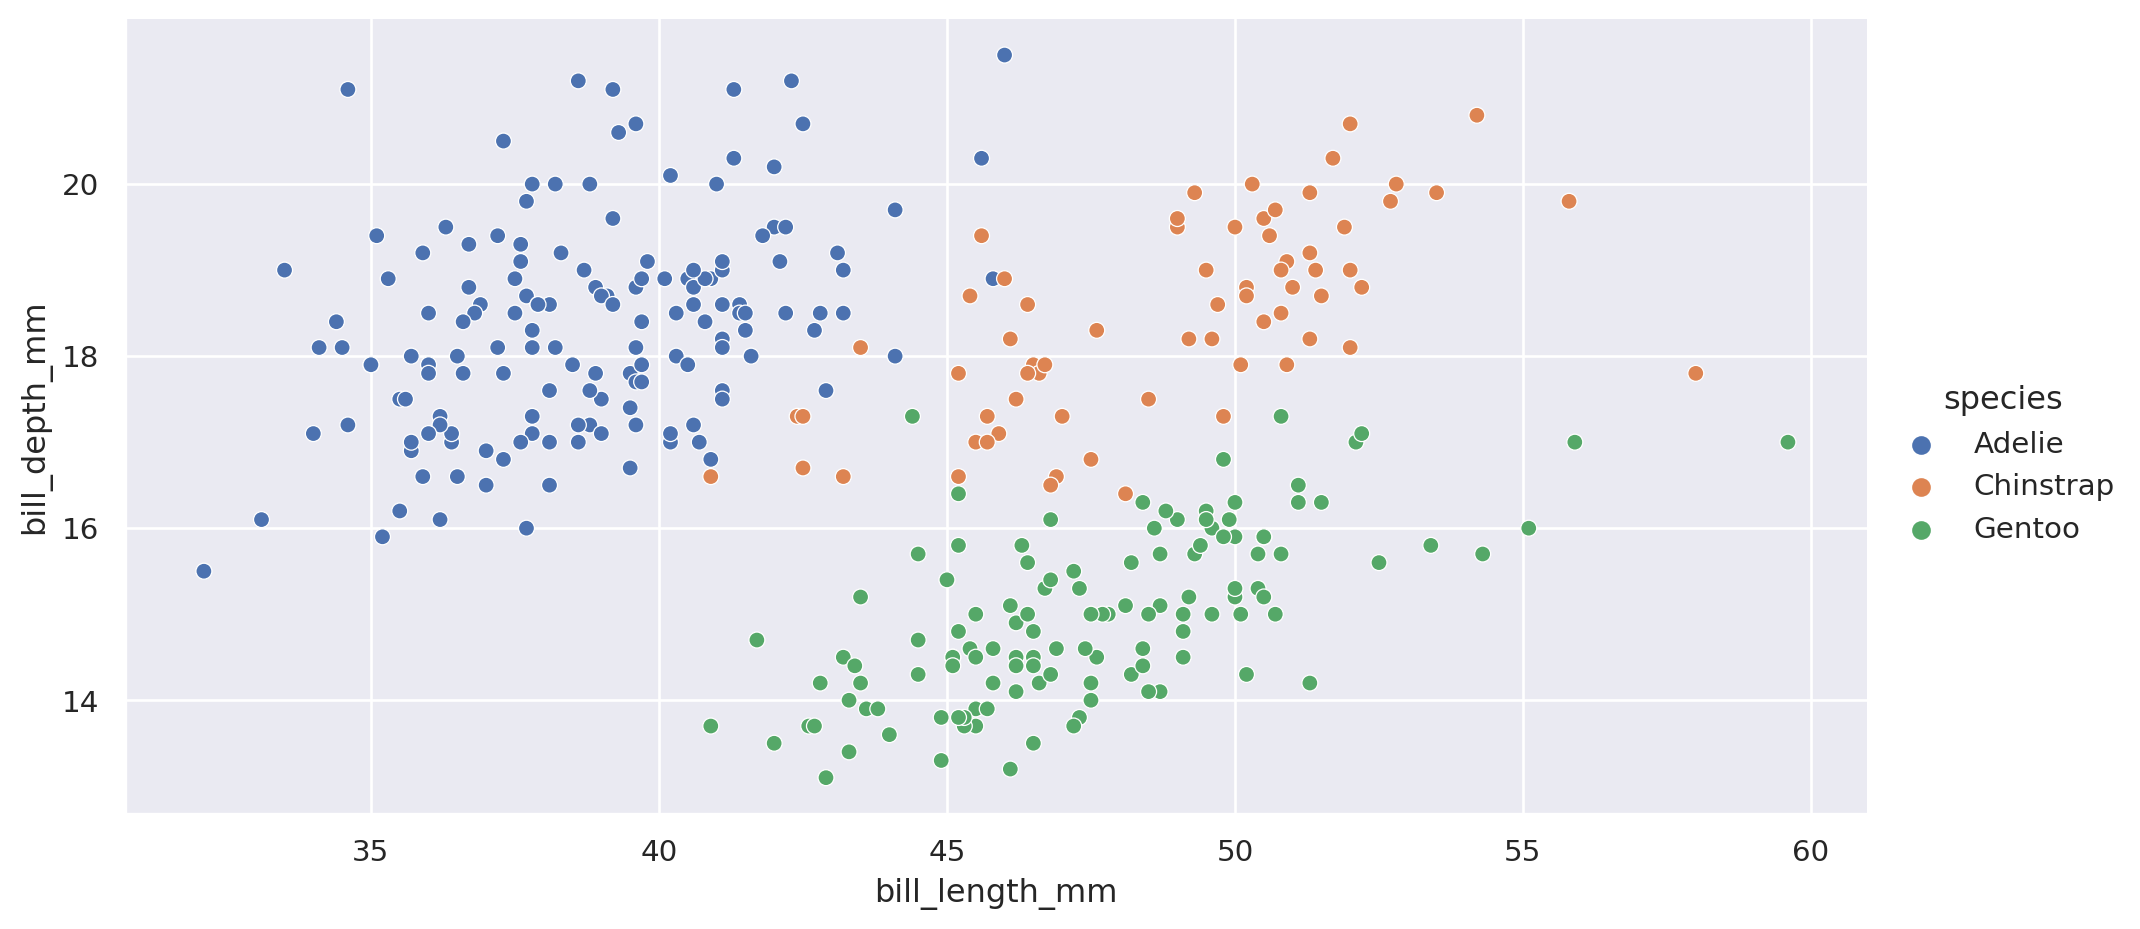
First, with Python:
import seaborn as sns
penguins = sns.load_dataset("penguins")

# setting the dimensions of the plot
g=sns.relplot(x="bill_length_mm", y="bill_depth_mm", data=penguins,
              hue="species", aspect=2)
plt.show()There is more,
col and row as seaborn.It is good.
Makie has a great documentation.
AlgebraOfGraphics is nice, worse documentation.
TidierPlots work, but there are missing features (like facet_wrap).
Conclusion: Make is madure and documented, AlgebraOfGraphics should improve.
It tries to be the scikit-learn for Julia.
It is a global wrapping API, does not implement algorithms.
Models Implemented in different packages: DecisionTrees.jl, MLFlux.jl, ParallelKMeans.jl, …..
include also models from scikit-learn, by ScikitLearn.jl.
Tuning.
Compatible packages for imbalanced data.
┌──────────────┬─────────────┬──────────────┬─────────────┬──────────────────────────────────┐
│ sepal_length │ sepal_width │ petal_length │ petal_width │ target                           │
│ Float64      │ Float64     │ Float64      │ Float64     │ CategoricalValue{String, UInt32} │
│ Continuous   │ Continuous  │ Continuous   │ Continuous  │ Multiclass{3}                    │
├──────────────┼─────────────┼──────────────┼─────────────┼──────────────────────────────────┤
│ 5.1          │ 3.5         │ 1.4          │ 0.2         │ setosa                           │
│ 4.9          │ 3.0         │ 1.4          │ 0.2         │ setosa                           │
│ 4.7          │ 3.2         │ 1.3          │ 0.2         │ setosa                           │
└──────────────┴─────────────┴──────────────┴─────────────┴──────────────────────────────────┘┌──────────────┬───────────────┬──────────────────────────────────┐
│ names │ scitypes │ types │
├──────────────┼───────────────┼──────────────────────────────────┤
│ sepal_length │ Continuous │ Float64 │
│ sepal_width │ Continuous │ Float64 │
│ petal_length │ Continuous │ Float64 │
│ petal_width │ Continuous │ Float64 │
│ target │ Multiclass{3} │ CategoricalValue{String, UInt32} │
└──────────────┴───────────────┴──────────────────────────────────┘
Schema are the types, you can convert.
y, X = unpack(iris, ==(:target); rng=123);
# Check the possible models for these data
models(matching(X,y))
54-element Vector{NamedTuple{(:name, :package_name, :is_supervised, :abstract_type, :constructor, :deep_properties, :docstring, :fit_data_scitype, :human_name, :hyperparameter_ranges, :hyperparameter_types, :hyperparameters, :implemented_methods, :inverse_transform_scitype, :is_pure_julia, :is_wrapper, :iteration_parameter, :load_path, :package_license, :package_url, :package_uuid, :predict_scitype, :prediction_type, :reporting_operations, :reports_feature_importances, :supports_class_weights, :supports_online, :supports_training_losses, :supports_weights, :target_in_fit, :transform_scitype, :input_scitype, :target_scitype, :output_scitype)}}:
(name = AdaBoostClassifier, package_name = MLJScikitLearnInterface, ... )
(name = AdaBoostStumpClassifier, package_name = DecisionTree, ... )
(name = BaggingClassifier, package_name = MLJScikitLearnInterface, ... )
(name = BayesianLDA, package_name = MLJScikitLearnInterface, ... )
(name = BayesianLDA, package_name = MultivariateStats, ... )
(name = BayesianQDA, package_name = MLJScikitLearnInterface, ... )
(name = BayesianSubspaceLDA, package_name = MultivariateStats, ... )
(name = CatBoostClassifier, package_name = CatBoost, ... )
(name = ConstantClassifier, package_name = MLJModels, ... )
(name = DecisionTreeClassifier, package_name = BetaML, ... )
(name = DecisionTreeClassifier, package_name = DecisionTree, ... )
(name = DeterministicConstantClassifier, package_name = MLJModels, ... )
(name = DummyClassifier, package_name = MLJScikitLearnInterface, ... )
⋮
(name = RandomForestClassifier, package_name = MLJScikitLearnInterface, ... )
(name = RidgeCVClassifier, package_name = MLJScikitLearnInterface, ... )
(name = RidgeClassifier, package_name = MLJScikitLearnInterface, ... )
(name = SGDClassifier, package_name = MLJScikitLearnInterface, ... )
(name = SVC, package_name = LIBSVM, ... )
(name = SVMClassifier, package_name = MLJScikitLearnInterface, ... )
(name = SVMLinearClassifier, package_name = MLJScikitLearnInterface, ... )
(name = SVMNuClassifier, package_name = MLJScikitLearnInterface, ... )
(name = StableForestClassifier, package_name = SIRUS, ... )
(name = StableRulesClassifier, package_name = SIRUS, ... )
(name = SubspaceLDA, package_name = MultivariateStats, ... )
(name = XGBoostClassifier, package_name = XGBoost, ... )# Load the class from the package
Tree = @load DecisionTreeClassifier pkg=DecisionTree
model = Tree()
# Apply Cross validation
evaluate(model, X, y,
resampling=CV(nfolds=5, shuffle=true),
measures=[log_loss, accuracy],
verbosity=0)import MLJDecisionTreeInterface ✔PerformanceEvaluation object with these fields: model, measure, operation, measurement, per_fold, per_observation, fitted_params_per_fold, report_per_fold, train_test_rows, resampling, repeats Extract: ┌───┬──────────────────────┬──────────────┬─────────────┐ │ │ measure │ operation │ measurement │ ├───┼──────────────────────┼──────────────┼─────────────┤ │ A │ LogLoss( │ predict │ 2.4 │ │ │ tol = 2.22045e-16) │ │ │ │ B │ Accuracy() │ predict_mode │ 0.933 │ └───┴──────────────────────┴──────────────┴─────────────┘ ┌───┬─────────────────────────────────┬─────────┐ │ │ per_fold │ 1.96*SE │ ├───┼─────────────────────────────────┼─────────┤ │ A │ [2.4, 2.22e-16, 1.2, 7.21, 1.2] │ 2.76 │ │ B │ [0.933, 1.0, 0.967, 0.8, 0.967] │ 0.0766 │ └───┴─────────────────────────────────┴─────────┘
RF = @load RandomForestClassifier pkg=DecisionTree

for (name, model) in [("DT", Tree()), ("RandomForest", RF())]
    sal = evaluate(model, X, y,
                resampling=CV(nfolds=5, shuffle=true),
                measures=[log_loss, accuracy],
                verbosity=0)
    log, accu = sal.measurement
    println("$(name): $log, $accu")
end
import MLJDecisionTreeInterface ✔
DT: 2.1626192033470293, 0.9400000000000001
RandomForest: 0.11242771720738147, 0.9533333333333334using MLJBase
RF = @load RandomForestClassifier pkg=DecisionTree
model = RF()
# holdout = Holdout(fraction_train=0.7, shuffle=true, rng=35)
train_index, test_index = partition(eachindex(y), 0.7, shuffle=true, rng=35)
mach = machine(model, X, y)
# Training
fit!(mach, rows=train_index)
# Predict
first(predict(mach, rows=test_index), 5)import MLJDecisionTreeInterface ✔5-element UnivariateFiniteVector{Multiclass{3}, String, UInt32, Float64}:
UnivariateFinite{Multiclass{3}}(setosa=>0.0, versicolor=>0.99, virginica=>0.01)
UnivariateFinite{Multiclass{3}}(setosa=>0.0, versicolor=>0.31, virginica=>0.69)
UnivariateFinite{Multiclass{3}}(setosa=>0.0, versicolor=>0.94, virginica=>0.06)
UnivariateFinite{Multiclass{3}}(setosa=>0.0, versicolor=>0.31, virginica=>0.69)
UnivariateFinite{Multiclass{3}}(setosa=>0.99, versicolor=>0.01, virginica=>0.0)It is extremely well documented.
In continuous improvement.
There is a step-learning from scikit-learn, specially about the scitypes.
Include TunedModels, but it is not so confortable as scikit-learn.
It can use scikit-learn models, but the error messages in that case are not good.
Conclusion: Good Tool, it compensates for learning, but worse than scikit-learn.
Flux.jl is the package for Deep Learning.
Lux is another one without mutation.
Both works in GPU, with worse performance than PyTorch.
All implemented in Julia, source code easy to read.
Installation without problem.
Very easy the API, errors few intuitive.
Metalhead.jl includes Convolutional models, but few have pre-trained values.
Implementation of FastAI, make easier to work with Flux models.
Conclusion: Still not mature enough for DL for complex usage.
SymbolicRegression.jl is a great package.
Wrapper using PySR in Python.
Successfully used in enterprise optimization problem.
Conclusion: In my opinion the best SR package in Julia/Python. The Python package make easier to incorporate it.
Julia is a great language for scientific computation.
Julia is ready for preprocessing, Data Manipulation and Visualization.
MLJ is rather ready for ML problems, it requires adaptation.
Deep Learning in Julia is interesting, but it still not mature enough for complex problems.
Wrapping Julia packages in Python packages seems a good strategy.
Conclusion: You should consider Julia for preprocessing, visualization, and for several excelent packages.